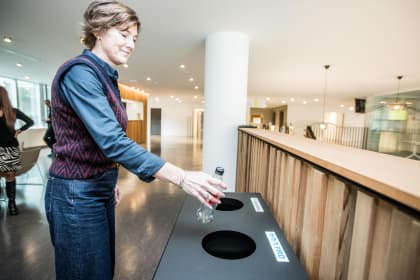
Improvement in PMD Sorting, but target not yet reached
The purity of the PMD (Plastic, Metal, and Drink cartons) fraction has increased from 92.54% to approximately 95%, showing noticeable improvement. However, this still remains 4.3 percentage points below the target, mainly due to the “Other” fraction (5%).
This “Other” category includes napkins, hard plastics, paper, and cardboard. During the first measurement in May 2023, the share of “Other” ranged between 5.12% and 10.86%, with an average of 7.46%. The current results are therefore at the lower end of that initial measurement.
Improvement in sorting of mixed and circular paper
The purity of the mixed and circular paper fraction has been further optimized, increasing from 98.92% to 99.70%. This improvement is partly due to the shift from mixed waste to circular paper.
The “Other” fraction decreased from 1% to 0.30%, which falls within the fluctuations observed in May 2023 (min. 0.01% – max. 2.15%). Overall, the sorting of paper and cardboard remains good and has even improved further.
A key point of attention remains the prevention of contamination from plastics and PMD, making continued awareness-raising essential.
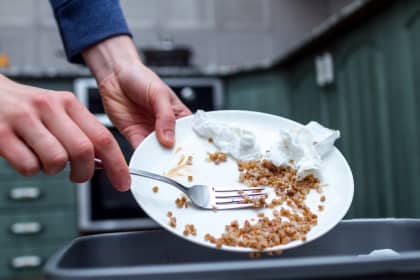
Analysis of Organic Waste
There is a high share of organic ‘Other’ in the residual waste. The amount of organic waste during the periods of May 5, 2023, and May 26, 2023, is comparable, but significantly lower than on May 12, 2023, and June 2, 2023. The share of “Other” (non-organic waste) remains relatively small.
Two main strategies/objectives:
Pure Biowaste Fraction (GFT – vegetables, fruits, and garden waste)
The purity of the GFT fraction has improved significantly, with Non-GFT decreasing on average from 1.06% to 0.11%.
Result: much cleaner GFT waste.
Minimizing food waste (reducing edible food in waste)
While the Non-GFT fraction has improved, the share of edible food waste remains well above the target, nearly 16% over the expected maximum value.
The “Other GFT” fraction was initially expected to be much higher (almost 19%), but it is now only 3%.
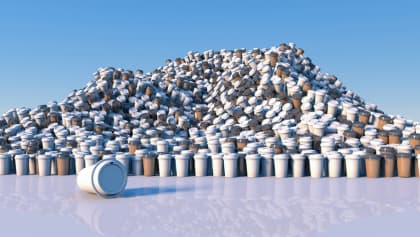
Analysis of residual waste
- Residual waste fraction: Substantially increased from 24.02% to 43.16%, representing a significant improvement. However, the target has not yet been reached.
- Residual waste composition: 43% vs. 70% target is mainly due to a significantly higher fraction of Organic – Other (non-edible). Possible reasons for this need to be investigated.
- Organic – Edible: Target almost achieved, but remains an area of attention.
- PMD (Plastic, Metal, Drink Cartons): Should ideally be 0%, but currently around 10% remains. Continued awareness-raising is needed.
- Waste bags: Significantly better than the target: successful.
Analysis of Residual Waste: Improvements and Points of Attention
The purity of the residual waste fraction has increased significantly, from 24.02% to 43.16%, representing a substantial improvement.
The total amount of residual waste has decreased. Residual waste now accounts for 43% of the total, instead of 70%, mainly due to the significantly higher fraction of “Organic – Other” (non-edible). It is important to further investigate the possible reasons for this increase.
Regarding organic edible waste, the target has almost been achieved, but it remains an area of attention. PMD waste should ideally be 0%, but currently remains around 10%, so continued awareness-raising is still necessary.
The reduction in waste bags is a positive outcome and is clearly below the target, which can be considered a success.